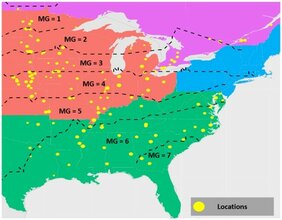
MLCAS2021 launches Crop Yield Prediction Challenge
This challenge is part of the MLCAS2021 workshop. Accurate prediction of crop yield can improve agricultural breeding and provide monitoring across diverse climatic conditions. This can protect crop production from climatic challenges. To predict crop yield, it is important to integrate weather information across the crop growing season for multiple genotypes. Unraveling the importance of different weather parameters for crop yield prediction would be a substantial step forward in understanding the impact of climate change on a variety’s plasticity.
Our dataset assimilates and utilizes complex data for crop yield prediction. This dataset can provide a significant advancement in the domain of yield prediction – previous works have mostly relied on a small subset of factors, therefore failing to capture the complexity of biological interactions and more site-specific weather variable complexities. Some approaches have been based on meteorological data (maximum daily temperature, minimum daily temperature) without field-scale farming data. It is important to develop models which can capture temporal correlations and our dataset can enable that.
New Special Issue in Plant Phenomics
Submission Deadline: June 30, 2023
Scope
Plant phenotyping is widely known as the basis of plant phenomics, which is the bridge as well as a bottleneck for studying the interactions between genomics and the environment. Recently, time-series phenotyping is gaining more and more attention due to its potential in revealing key trait differences in critical growth periods as well as a way to access more functional traits. Meanwhile, proximal sensing and image analysis have brought a renaissance in plant phenotyping. It is possible to combine multi-source proximal sensing techniques, such as RGB, light detection and ranging (LiDAR), multi/hyperspectral, solar-induced fluorescence (SIF), and thermal sensors, to better describe plant growth and development. Image analysis, especially computer vision and data-driven deep learning methods, can make phenotyping more objective, accurate, and efficient than traditional field measurement. Therefore, combining advanced proximal sensing and image analysis will provide a comprehensive study of time-series plant phenotyping.
Given the above context, this special issue invites submissions broadly contributing to time-series plant phenotyping. Specific topics of interest include:
- Data fusion of multi-source proximal sensing imagery to provide consistent spatial and temporal support.
- Methods in time-series phenotyping including object detection, tracking, trait extraction, etc.
- Application of time-series imagery to plant breeding, cultivation, and management.
Articles must be original research, not published elsewhere. All articles will go through a rigorous peer-review process as per the journal norms. Review articles around the topics are also encouraged. Articles must follow the instructions for authors at https://spj.sciencemag.org/journals/plantphenomics/guidelines/.
Guest Editors
Shichao Jin, Nanjing Agricultural University
Yanjun Su, Institute of Botany, Chinese Academy of Sciences
Changying Li, University of Georgia
Qinghua Guo, Peking University
Submission Deadline
June 30, 2023. All papers will be published online after acceptance.
Submission Instructions
Please submit the full manuscript to Plant Phenomics via our online submission system. When submitting, please indicate in your cover letter that your submission is intended for consideration for the special issue, Advances in Proximal Sensing and Image Analysis for Time-Series Phenotyping. For inquiries, please contact Dr. Shichao Jin (jschaon@njau.edu.cn).
Greece: Intelligent system to monitor health of olive groves
Olives and olive oil are important for the European Union, in particular those Member States with Mediterranean coastlines. Spain alone produces 36% of the world’s olive oil, and the sector is a major contributor to the economies of Greece, Italy, and Portugal, and is also important to Cyprus, France, and Slovenia. Additionally, Italy and Spain are the largest consumers of olive oil in the EU, with an annual consumption of around 500,000 tons each, while Greece has the biggest EU consumption per capita, with around 12 kg per person per year. In total, the EU accounts for around 53% of world consumption. In terms of trade, the EU represents roughly 65% of world exports of olive oil. But the economic benefits of olive oil production, and of the production of table olives, come at a cost. Olive growing has become more intensive over the last three decades and is using an increasing amount of agricultural land. This intensification and expansion in the cultivation of olives have contributed to the significant spread and amplified the consequences of many diseases affecting olive trees. Among those, the most important fungal problem is verticillium wilt. The solutions available to tackle Verticillium’s effects require the accurate classification of trees in the early stages of infestation—a task that is impractical with traditional means but also very difficult, as early stages are almost impossible to distinguish by visual inspection.
All the above constitute the underlying context of MyOliveGroveCoach project, which utilizes multispectral imaging from unmanned aerial vehicles to develop an olive grove monitoring system based on the autonomous and automatic processing of the multispectral images using computer vision and machine learning techniques. The goal of the system is to monitor and assess the health of olive groves andprovide novel solutions for the early detection of Verticillium wilt and its spread. Olive cultivation in Greece represents a large percentage of the total agricultural land and a very large percentage of agricultural land that would be, considering territorial characteristics such as low fertility and sloping, difficult or economically impractical to exploit with other crops. Therefore, the effects of Verticillium are quite severe also from an economic point of view since it contributes to a serious reduction in olive
productivity, plant capital destruction and subsequently leads to derivative unwanted effects such as increased soil degradation. Verticillium wilt causes a gradual malfunction and eventually a complete blockage of the vessels of the tree, in part or in whole, interrupting the movement of water from the roots to the leaves, resulting in interruption of the water supply in the affected part of the tree. This reduction in water supply leads to nutritional deficiencies and even starvation of the branches. Before the complete blockage and total necrosis of the affected tissue associated with the part of the root that has been infected, there precedes a stage of temporary water stress, a reversible stress, which can be mainly attributed to the closure of the stomata of the affected plant tissue [2], stunting, chlorosis or yellowing of the leaves, necrosis or tissue death, and defoliation. Internal vascular tissue discoloration might be visible when the stem is cut.[1] In Verticillium, the signs and effects will often only be on the lower or outer parts of plants or will be localized to only a few branches of a tree. The severity of the infection plays a large role in how severe the signs are and how quickly they develop.
In the preliminary stage of early wilt infection, the natural process of photosynthesis is impaired, since the leaf pigments that are responsible for the canopy photosynthetic activity (mainly chlorophyll) are unable to function properly [3]. This impediment of the photosynthetic activity leads to a subsequent degradation of the canopy pigment percentage which results in a reduction of plant canopy reflectance in the Near Infrared wavelengths. As the infection progresses and because of the slow degradation of chlorophyll in the canopy the reflectance in the Green wavelengths (640nm) is also affected leading to light-green discoloration of the leaves; a discoloration that even in this stage of verticillium infection is very subtle and very difficult to detect with the naked eye, especially in there where photosynthetic activity has been hampered but the percentage of chlorophyll pigments in the canopy is still adequate for a functional photosynthetic activity.
Thermal and multispectral surveying has shown high correlations of leaves’ spectral characteristics with the degree of infestation, as measured in the 11 point [4]. On this basis, using Remote Sensing technologies enabled by the advent of small format high resolution multispectral sensors carried by unmanned aerial vehicles with autonomous mission capabilities. The team comprised of Kostas Blekos, Anastasios Tsakas, Aris Lalos, Ioannis Evdokidis, Dimitris Alexandropoulos, Christos Alexakos, Athanasios Kalogeras (Industrial Systems Institute, Athena Research Center, Patras, Greece), Sofoklis Katakis, Andreas Makedonas, Christos Theoharatos (Irida Labs S.A., Patras, Greece), Christos Xouris (Gaia Robotics S.A., Patras, Greece) created the platform “My Olive Grove Coach” (MyOGC). The main goal of MyOGC is the development of an intelligent system that will monitor olive groves and support farmers in the detection and treatment of Verticillium, using multispectral sensors and spectrophotometers. All raw data collected by the dedicated multispectral sensors are algorithmically processed and augmented by machine learning techniques. Finally, the end-results are visualized in a user friendly way so that producers and agronomists have access to reliable, actionable and customizable data, according to the principles of human-centered design.
With MyOGC it will be possible to (a) collect actionable data on the progress and spread of tree infestation; (b) quickly detect the problem using innovative signal processing methods and multispectral imaging and computer vision, in combination with machine learning techniques, thereby providing accurate spatial identification of affected trees; (c) guide the producers/agronomists when required, with a user-friendly communication and decision-making support system, with maps of quantitative and qualitative characteristics of the grove, that will help them optimize their olive management practices thus leading to (d) better yield quantity and quality while achieving a lesser environmental footprint of agricultural practices.
References
[1] Herder, M.D.; Moreno, G.; Mosquera-Losada, R.; Palma, J.; Sidopoulou, A.; Santiago Freijanes, J.J.; Crous-Duran, J.; Paulo, J.A.; Tomé, M.; Pantera, A.; et al. Current Extent and Trends of Agroforestry in the EU27. Available online: www.agforward. eu/index.php/en/current-extent-and-trends-of-agroforestry-in-the-eu27.html (accessed on 30 November 2020).
[2] Calderón, R.; Navas-Cortés, J.A.; Lucena, C.; Zarco-Tejada, P.J. High-resolution airborne hyperspectral and thermal imagery for early detection of Verticillium wilt of olive using fluorescence, temperature and narrow-band spectral indices. Remote Sens. Environ. 2013, 139, 231–245. [CrossRef]
[3] Fradin, E.F.; Thomma, B.P. Physiology and molecular aspects of Verticillium wilt diseases caused by V. dahliae and V. albo-atrum. Mol. Plant Pathol. 2006, 7, 71–86. [CrossRef] [PubMed]
[4] Zartaloudis, Z.; Iatrou, M.; Savvidis, G.; Savvidis, K.; Glavenas, D.; Theodoridou, S.; Kalogeropoulos, K.; Kyparissi, S. A new 11-point calibration scale of Verticillium wilt of olive verified by thermal remote sensing and plant analysis. In Proceedings of the 17th PanHellenic Plant Pathology Conference, Volos, Greece, 13–18 October 2014
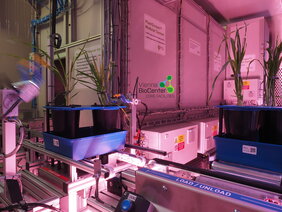
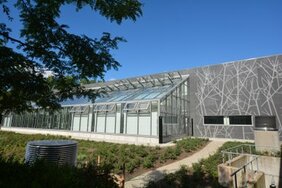
Austria: New high-throughput phenotyping platform at Vienna BioCenter Core Facilities (VBCF)
Within the planned infrastructure, plants are transported on conveyor belts from the growth area to the imaging cabinets equipped with state-of-the-art sensors. The imaging units are physically separated from the growth area (two individually controlled phytotrons) facilitating the parallelization of measurements via a sample loop and thus improving the throughput, flexibility and sensor utilization.
The PHENOPlant project evolved out of the Austrian Plant Phenotyping Network (APPN.at) initiative, was funded by the Austrian Research Promotion Agency (FFG) and built by PSI (Photon System Instruments).
The infrastructure is operated by the Plant Sciences Facility of the Vienna BioCenter Core Facilities GmbH and available in a fee4service mode to national and international user from academia and industry.
Specifications:
Environment:
- Temperature: 0°C-40°C
- Humidity: 40-80% rel.hum.
- Light: adjustable LED light spectrum, up to 1000 µmol m-2 s-1
- CO2: ambient – 2000 ppm
- Highly controlled environments & dynamic simulations
Capacity:
Designed for crop plants up to 100cm height (incl. pot), 50cm width and for Arabidopsis
- 200 x 5L pots or
- 400 x 3L pots or
- 800 x 2L pots or
- 4000 x 250mL pots (Arabidopsis).
Sensors:
- RGB (top- & side-view)
- 3D laser scan
- PAM chlorophyll fluorescence
- LWIR thermal imaging
- Hyperspectral imaging (VNIR and SVIR)
- Automatedweighing & watering stations (two tanks each).
- Mobile weather stations for live dynamic environmental simulation
Contact:
Jakub Jez
Head, Plant Sciences Facility
Vienna BioCenter Core Facilities Gmbh (VBCF)
Dr. Bohr Gasse 3
1030 Vienna, Austria
https://www.viennabiocenter.org/vbcf/plant-sciences/phenoplant/
https://twitter.com/VBCF_PlantS
https://www.linkedin.com/in/jezjakub/
https://www.plant-phenotyping.org/db_infrastructure#/tool/156/
Sweden: A virtual tour of the Biotron at SLU Alnarp
The tour was held over zoom by Ramesh Vetukuri, who is the Biotron Development leader and Julia Nilsson who is a Horticultural Engineer at the Cultivation Unit. They guided the approximately 35 participants through the facility and showed the various growth chambers. After the presentation there was a lively session of questions and answers. The whole presentation was recorded and can be seen here.
Italy: Successful first Phen-Italy call for access to plant phenotyping infrastructures
Participation to the call has demonstrated once more the great interest plant phenotyping covers in Italy and the raising needs to invest in this emerging field for sustaining plant productivity and efficient use of resources in agriculture and forestry.
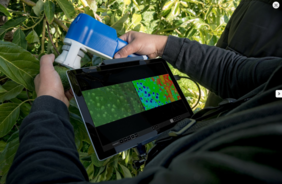
Greece: Lab-in-the-field, multi-spectral imaging technology for early warning of plant stress and pathologies
Chania, 26/03/2021
The project takes full advantage of the unique capabilities of QCELL’s PhenoCheck camera, a battery operated, wearable/handheld macro-imaging system to monitor crops in situ. The PhenoCheck camera collects spectral information from leaves, stems, fruits, etc. and can display, in real time, a vegetation index and spectral maps in reflectance and fluorescence imaging modes. The camera integrates a specially adapted dome illumination module for isolating ambient light and providing consistently calibrated illumination and reliable measurements.
The project partners are focusing on tomato, pepper, aubergine and other plants under biotic and abiotic stresses. At any selected spot, the PhenoCheck handheld camera instantly provides information about changes in the spectral phenotype and helps to monitor and control treatment options. For example, the device might provide early warning for fungal infections (e.g. Botrytis cinerea) before the effects become visible. In addition, the effects of salinity stress might be identified at an early stage and reliably quantified to guide intervention. Another important application of the PhenoCheck camera might be the fruit ripening assessment to predict the optimal harvest date. By offering spectral information in the Near Infrared (NIR) spectral range, internal quality attributes are obtained. These data, together with the measured spectra in the visible part of the spectrum, offer a better prediction of fruit ripeness.
This technology could become a powerful tool in the hands of agricultural scientists and individual growers, with software modules that address a large array of applications for the smart farm. Accelerating the Agri-tech revolution, the SpectraPlant project team collects carefully curated spectral data and provides laboratory-based analyses of the specimens. The data are analysed with sophisticated mathematical models and artificial intelligence methods to improve the analytical power of the platform and expand its reach in various conditions that affect the plant phenotype. By integrating all these unique features, the PhenoCheck camera comprises a valuable tool for controlling and optimizing farming by enabling reduced use of fertilizers, pesticides and water.
New tools for data sharing in plant research
The tools have been developed by a team from EMPHASIS in collaboration with ISBE and ELIXIR within the EOSC-Life demonstrator project Plant A+. The objectives of Plant A+ are to cross data from different domains – phenomics, genetics and environmental data – and to improve standardisation to enable integration and re-use of existing data in plant science.
Italy: Phen-Italy launches first call for access to national phenotyping infrastructures
Access to research infrastructures is granted on the basis of a research project proposal aiming at answering a clear scientific question and addressing a technological challenge in the field of plant phenotyping.
The application can be submitted by a single user or a research group. In the latter case, the application must be submitted by the group leader.
Each individual user (or research group) can submit only one application for access to the research infrastructures.
Infrastructures participating in the call:
- ALSIA FieldNet
- ALSIA PhenoLab
- CREA-CI Field Phenotyping Platform
- Nitrogen forest experiment
- PIANTA
- Root-DISTAL-UNIBO
Deadline for submission: 23 April 2021
EOSC-Life publishes midterm Achievements Brochure
Within the EOSC-Life project, 13 ESFRI projects from the Health & Food sector including EMPHASIS are developing a digital platform for cooperation across disciplinary boundaries in order to make data available and usable in accordance with FAIR principles.
The 12-page brochure features an updated design and offers a brief overview of the project, followed by achievements in the following areas:
- Populating the EOSC with data
- Packaging tools and workflows for use in the cloud
- Cloud deployment and cloud resources
- Providing access
- Connecting users
- Informing & training users
Browse through the brochure and find out how you can benefit from work we’re doing within the project!